Bitcoin: exploring behavior on the block chain
Bitcoin gained popular notoriety because of its rapid price appreciation and volatility, but its block chain also represents a self-recording and detailed account of users’ behavior. Theoretically, the block chain preserves aspects of that behavior, and how it changes as as people learn about this tech and develop individual sophistication and group-level norms.
The first step in this analysis is extraction of behavioral data from the block chain - creating a transaction digraph, then an entity digraph. Then I can explore entity activity patterns related to price peaks in Bitcoin’s history.
Data extraction
Users interact with each other through Bitcoin using supposedly anonymous bitcoin addresses (Note that I’m considering anonymity in the block chain, isolated from other data ;)). Each address is associated with the public part of a public-private key pair, and a user can create new addresses at will. Users transfer funds from one address to another using an atomic data structure: the transaction.
Transactions are collections of inputs and outputs, where inputs reference the outputs of transactions already in the block chain. New transactions redeem collections of existing, unredeemed outputs in the block chain, then reassign portions of their total value to addresses in newly created outputs. New BTC is injected into the block chain as a reward to miners for adding transactions. Rewards come in the form of special generating, or “coinbase”, transactions which assign reward BTC to addresses specified by the miner. This BTC is then available to be reassigned to other addresses through successive transactions. The net worth of a particular address \(a_i\) at a given time is the sum of all reassignments bestowing BTC to \(a_i\), less the reassignments from \(a_i\) to other addresses, where all reassignments occur before the specified time.
The transaction graph
The block chain is essentially a digraph of transaction nodes, where every arc is an output-input pair with address and value attributes. Transactions are validated and added in blocks, so each transaction in a block has the same timestamp. A toy example of transactions in the block chain is presented below.
Because the input addresses of a transaction must be controlled by a single source, I can scan the transaction graph and aggregate addresses into entities. Entities are one step closer to representing actual users, but could be individuals or groups or bots: whatever exerts control over the aggregated addresses. Each transaction then represents one or more fund reassignments from entity to entity, creating an entity network.
To make the entity network, I must do the following:
- Create the transaction graph from the stored block chain.
- Extract the address and timing information in the transaction graph.
- Deanonymize by collapsing the input address sets of transactions with commonly held addresses into entities.
- Extract timestamp and value attributes for arcs between entities from transactions in the transaction graph.
Below, we see the creation of the entity graph from our toy transaction graph.

Fun with BTC price spikes and user behavior
Up until early 2014, there were three Bitcoin price spikes. These are marked below, in regions lasting 20 days before to 20 days after each price peak.

These price peaks are natural points to examine user behavior. Below, I visualize change of BTC wealth vs. initial holdings per entity during the first price peak. Importantly, the x-axis shows the rank of entities’ BTC wealth 20 days before the peak, while the y-axis shows entities’ net wealth change over the period. The vertical lines indicate intervals of actual BTC worth, as opposed to the entity worth rank shown on the x-axis.
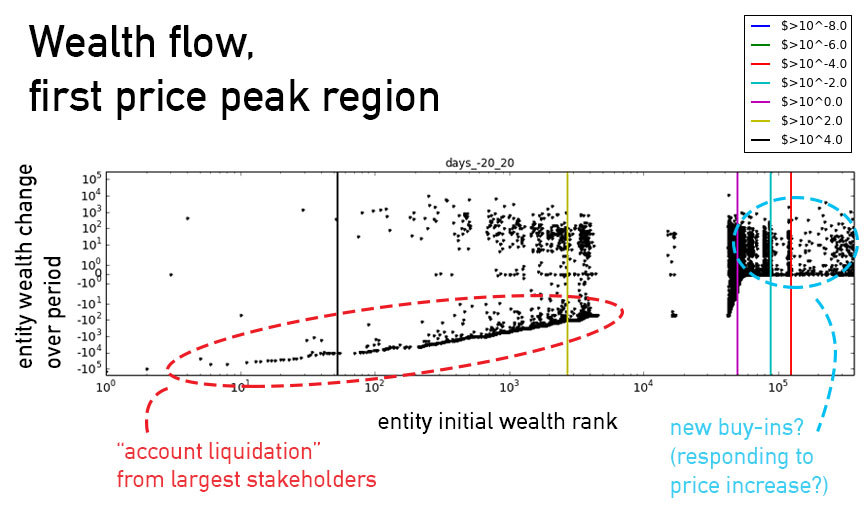
This scatter plot shows some interesting behavior! High rollers essentially emptied their accounts, or at least transferred most of their wealth to other entities (aggregated to early 2014). At the other extreme, BTC-poor entities increased their holdings, perhaps reacting to the price appreciation before the peak.
There are many more avenues to explore with this data (hint: deanonimization) but this was a fun first look!